

Knowing how to prioritise construction opportunities by area is one of the most underrated competitive advantages in contracting. Most firms waste significant time and resource chasing work across too wide a geography, spreading their teams thin and eroding margins in the process. The result is a bloated bid pipeline with poor conversion rates and projects that cost more to deliver than they should. This article gives you a practical, data-driven framework for geographic prioritisation, covering everything from initial data analysis through to operationalising your focus areas and measuring the results.
Table of Contents
- Key takeaways
- Mapping your service area with data
- A step-by-step method for geographic prioritisation
- Integrating prioritisation into your operations
- Common pitfalls to avoid
- Measuring the success of your strategy
- Why most contractors get this wrong
- How Pulsepermit helps you focus on the right areas
- Common questions
Key takeaways
| Point | Details |
|---|---|
| Map your service area first | Use job-level data to identify which postcodes generate the most revenue and margin before bidding. |
| Apply the 80/20 rule | A small number of areas typically account for the majority of revenue; concentrate resources there. |
| Score projects on multiple criteria | Combine revenue, margin, job volume, and local constraints to rank opportunities accurately. |
| Connect prioritisation to operations | Geographic focus only delivers results when linked to dispatch, marketing spend, and resource planning. |
| Review quarterly | Market conditions and planning activity shift; update your geographic priorities every three months. |
Mapping your service area with data
The foundation of any geographic prioritisation strategy is knowing what your historical data actually says. Before you can select construction projects by location with any confidence, you need to organise your past job records by geography and run the numbers.
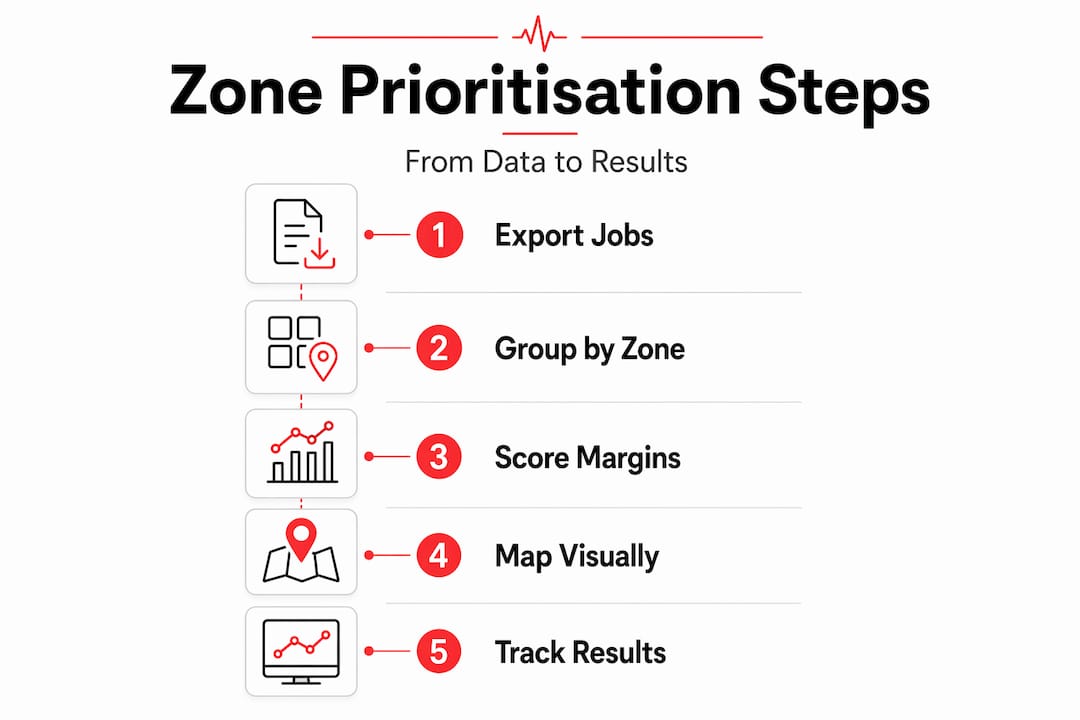
Start by exporting your completed jobs from your CRM, accounting software, or job management system. The key fields you need are postcode, revenue, job cost, margin, and project type. Once you have that data in a spreadsheet, create a pivot table that groups jobs by postcode and calculates four figures for each: total job count, total revenue, average revenue per job, and gross margin percentage.
What you will find is almost always striking. Pareto analysis consistently shows that just 3 to 5 postcode areas generate between 50 and 70% of a contractor's total revenue. Those are your primary zones. The next tier of postcodes, which contribute meaningful but secondary revenue, are your growth areas. Everything else is low-return territory where you are spending time and fuel for disproportionately small returns.
Pro Tip: Add a column for travel time or distance from your depot to each postcode cluster. A job that looks profitable on paper can become marginal once you account for two hours of windscreen time each way.
Here is an example of what that analysis might look like once structured:
| Postcode zone | Job count | Total revenue | Avg margin |
|---|---|---|---|
| Primary (top 5 postcodes) | 48 | £420,000 | 34% |
| Secondary (next 10 postcodes) | 31 | £185,000 | 27% |
| Low-return (remaining) | 22 | £63,000 | 18% |
Once you have this table, plot the zones on a map using Google My Maps or a similar tool. Visual representation matters. Seeing your primary ground as a cluster around your depot, versus scattered low-return jobs spread across a 40-mile radius, makes the prioritisation decision obvious.
A step-by-step method for geographic prioritisation
With your data mapped, you can now apply a structured method to rank and select areas for focused bidding. This is construction opportunity mapping turned into a repeatable workflow.
-
Define your scoring criteria. The most common mistake is ranking areas by revenue alone. Margin tracking at job level is necessary to avoid drawing the wrong conclusions. A postcode with high turnover but thin margins should rank below one with moderate turnover and strong margins.
-
Apply weighted scoring. Assign a weight to each criterion based on your business priorities. A typical weighting might be: gross margin (40%), job volume (25%), revenue concentration (20%), and strategic fit or growth potential (15%). Score each postcode zone against these criteria and calculate a composite score.
-
Use clustering to group similar areas. Research published in PLOS One found that sub-criteria based rankings using methods like K-means clustering and MULTIMOORA selection produce significantly better project portfolio decisions than broad criteria alone. You do not need to run complex algorithms. The principle applies even in a spreadsheet: group postcodes with similar profiles and treat each cluster as a decision unit.
-
Factor in local constraints. Planning activity, access restrictions, local authority procurement rules, and seasonal demand all affect whether a zone is genuinely worth pursuing. Local tailored strategies consistently outperform approaches based on national demand patterns.
-
Classify zones into tiers. Assign each postcode cluster a tier: Tier 1 (primary focus, maximum bid effort), Tier 2 (selective bidding where margin and fit are strong), and Tier 3 (opportunistic only, no proactive marketing spend).
Pro Tip: Run this scoring exercise quarterly rather than annually. Planning pipelines and local market conditions shift faster than most contractors realise, and a zone that was Tier 3 six months ago may have become a hotspot following a new development approval.
The comparison below illustrates how two seemingly similar areas can rank very differently once multiple criteria are applied:
| Criteria | Zone A | Zone B |
|---|---|---|
| Avg gross margin | 31% | 22% |
| Job volume (last 12 months) | 14 | 19 |
| Travel time from depot | 25 min | 55 min |
| Active planning applications | High | Low |
| Composite score | 78/100 | 51/100 |
Zone B looks attractive on job volume alone. Factor in margin and travel time, and Zone A is clearly the better focus area.

Integrating prioritisation into your operations
Knowing which areas to target is only half the job. The real value comes from connecting that knowledge to how your business actually runs day to day. Geographic prioritisation linked to dispatch routing, sales follow-up, and geo-targeted marketing is what turns analysis into profit.
Here is how to operationalise your geographic focus:
- Dispatch and scheduling. Brief your operations team on your Tier 1 and Tier 2 zones. When allocating crews, prioritise jobs in primary areas over outlying requests. This reduces travel costs and keeps your team concentrated in familiar territory.
- Marketing spend. Direct your paid advertising, leaflet drops, and direct mail campaigns exclusively toward your Tier 1 zones. Radius-based mapping and heat-mapping tools allow you to target subcontractor invites and bid activity precisely, reducing wasted outreach.
- Pipeline visibility. Many local authorities publish capital project maps and planning registers online. Cities and councils regularly update public construction project tools, which means you can track active projects by location and status without relying solely on tender portals.
- Data refresh cadence. Build a quarterly calendar to refresh your geographic data. Multiple opportunity sources update at different frequencies, and stale data leads to missed bids or wasted effort on projects already awarded.
Pro Tip: Create a simple one-page zone map and share it with your estimating and sales teams. When everyone knows which areas are Tier 1, bid decisions become faster and more consistent.
Common pitfalls to avoid
Even well-intentioned geographic prioritisation can go wrong. These are the mistakes that most frequently undermine the process:
- Prioritising by revenue without margin. This is the most common error. A high-revenue postcode with poor margin is a trap. Always tag costs at job level before drawing any conclusions about which areas are genuinely profitable.
- Spreading marketing effort too evenly. Many contractors run the same marketing activity across their entire service area. Focusing effort where data shows highest returns is the approach that actually moves the needle.
- Ignoring local policy and delivery constraints. A zone may look excellent on paper but carry hidden complications: restricted access, long planning determination timescales, or a local authority with a strong preference for framework contractors. These factors must be part of your evaluation.
- Skipping the review cycle. Geographic priorities set once and never revisited become outdated quickly. Market conditions, planning policy, and competitor activity all shift.
- Stopping at the analysis stage. This is perhaps the most frustrating failure mode. Firms invest time in mapping and scoring, then fail to connect the output to actual operational decisions.
"The map is not the territory. Geographic prioritisation only delivers results when the analysis is translated into daily decisions about where to bid, where to send crews, and where to spend your marketing budget."
Measuring the success of your strategy
Once your geographic prioritisation strategy is running, you need to track whether it is working. The metrics that matter most are straightforward, but they require consistent data collection to be useful.
| Metric | What it tells you | Review frequency |
|---|---|---|
| Revenue concentration by zone | Whether primary zones are growing their share | Monthly |
| Margin by postcode cluster | Whether focus areas are delivering better profitability | Monthly |
| Bid success rate by tier | Whether Tier 1 bids convert at a higher rate | Quarterly |
| Travel cost per job | Whether geographic focus is reducing mobilisation costs | Quarterly |
Connect these metrics to your CRM or job management dashboard so they update automatically. The goal is to see revenue concentration increasing in your Tier 1 zones over time, alongside improving margins and bid conversion rates.
Pro Tip: Set a simple target: within six months of implementing geographic prioritisation, at least 60% of your new revenue should come from Tier 1 zones. If it is not, your operational integration needs attention, not your analysis.
Adjust your zone classifications when the data warrants it. A new commercial development or infrastructure programme in a Tier 2 area may justify promoting it to Tier 1. Equally, a Tier 1 zone that has become saturated with competitors may need to drop in priority.
Why most contractors get this wrong
I have watched construction businesses of all sizes struggle with geographic prioritisation, and the pattern is almost always the same. The analysis gets done once, usually after a difficult quarter, and then sits in a spreadsheet that nobody looks at again. The insight is there. The discipline to act on it is not.
In my experience, the firms that get this right do not necessarily have better data or more sophisticated tools. They have made a deliberate decision to stop chasing every opportunity within driving distance and start treating their geographic focus as a strategic asset. That shift in mindset is harder than it sounds when the phone is ringing with enquiries from outside your priority zones.
What I have found is that the combination of job-level margin tracking and a quarterly review cadence is the minimum viable discipline. Without both, the analysis drifts out of date and the team reverts to old habits. The technology matters less than the process. A well-maintained spreadsheet beats an unused piece of software every time.
The other thing worth saying plainly: geographic prioritisation is not about turning down work. It is about knowing which work to pursue aggressively and which to price at a premium that reflects the true cost of delivery. That framing makes it much easier to get buy-in from estimators and sales teams who worry that narrowing focus means losing revenue.
— Anthony
How Pulsepermit helps you focus on the right areas
If the analysis above feels like a significant lift to build from scratch, Pulsepermit removes much of the groundwork. The platform pools data from public UK council planning registers daily, giving you a live feed of planning applications ranked and filtered by your chosen geographic areas.

Rather than trawling multiple council portals and cross-referencing postcode data manually, you get a ranked list of opportunities tailored to the regions you care about. The command centre dashboard lets you monitor live planning feeds, assess project viability with the built-in quote calculator, and act on the best opportunities before competitors do. You can explore coverage areas to confirm Pulsepermit serves your priority zones, then set up your profile to receive only the opportunities that match your geographic and project-type criteria. Fresh data every day means your pipeline reflects what is actually happening in your target areas right now.
Common questions
What does it mean to prioritise construction opportunities by area?
It means using data on revenue, margin, job volume, and local conditions to rank geographic zones and concentrate bidding, marketing, and operational effort on the areas most likely to deliver profitable work.
How do I identify my primary construction zones?
Export your historical job data, group it by postcode, and calculate revenue and margin per area. Pareto analysis typically shows that 3 to 5 postcodes account for the majority of your revenue, making those your primary zones.
Why is margin more important than revenue in geographic analysis?
Revenue tells you where the work is. Margin tells you where the profit is. A high-revenue zone with poor margins, often caused by hidden job-level costs or long travel times, can be less valuable than a moderate-revenue zone with strong profitability.
How often should I review my geographic priorities?
A quarterly review cadence is the minimum recommended frequency. Planning pipelines, competitor activity, and local market conditions all shift, and priorities set annually quickly become outdated.
Can small contractors benefit from geographic prioritisation?
Absolutely. Smaller contractors with limited crews and estimating capacity benefit most from focused geographic strategies, since spreading effort across a wide area has a proportionally greater impact on their margins and team capacity.